信用リスクスコアリングのためのWOEとIV分割
証拠の重み、情報価値、そしてインテリジェントなセグメンテーション
データサイエンティスト、信用リスクチーム、貸し手、マーケター向けのWebベースのWOE分割ツール。
明快さを重視。IV、KS、Gini、PSI、スコアカード開発に対応。
当社チームが管理 • 信頼できるサービス、設定不要
主要な金融・テック機関から信頼
インテリジェントなセグメンテーション。
生データを実行可能なインサイトへ変換します。
透明性のある戦略的インテリジェンスとリソース最適化のためのエンジン。明快さのために設計され、セグメンテーションで駆動します。
ケーススタディ
さまざまな分野におけるインテリジェントなセグメンテーションとWoEベース分析の実世界の応用
The Engagement Paradox: When Usage Misleads and Segmentation Tells the Truth
Most companies track customer metrics—such as usage frequency, tenure, and support interactions—but few truly understand what these numbers reveal about their business health. Traditional correlation analysis might indicate that "higher usage correlates with lower churn", but it does not reveal where the critical thresholds lie, which segments are losing revenue, or why even the most engaged customers still leave.
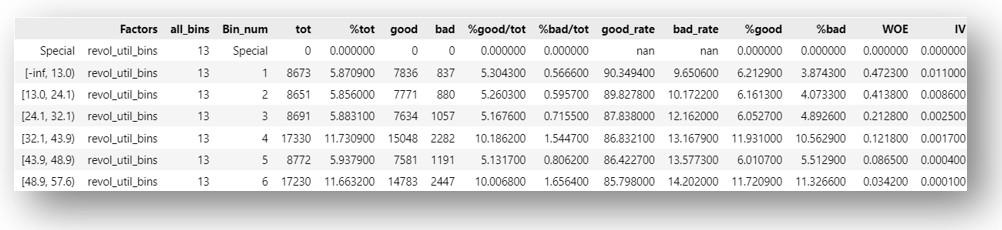
This is where Smart Segmentation (binning) analysis with Weight of Evidence (WOE), Information Value (IV), KS statistics, and Gini coefficients transforms raw data into strategic intelligence. By segmenting continuous variables into discrete bins, we can uncover non-linear relationships, identify crucial tipping points, and measure the true predictive power of each feature.
Here is what makes this approach revolutionary:
Information Value (IV) quantifies how strongly a feature predicts churn (0.02–0.1 = weak, 0.1–0.3 = moderate, 0.3+ = strong).
Weight of Evidence (WOE) reveals whether this bin increases or decreases churn probability.
KS Statistic identifies the maximum separation point between churners and non-churners.
Gini Coefficient measures the overall discriminatory power (ability to separate churners and non-churners) and the direction of the relationship.
Instead of simply knowing that "usage matters," we discover that customers with 8–30 uses still churn at 43%, meaning high activity does not guarantee retention. Instead of believing that "tenure builds loyalty", we find that customers at 30+ months churn at 56%—worse than new customers—indicating a value decay challenge. Instead of assuming "support shows engagement," we learn that 62% of customers make 5–10 support calls and 61% of them churn, exposing a fundamental product usability problem.
In the following three analyses, we examine:
Usage Frequency (IV: 0.120) — Why your power users are still leaving

Tenure (IV: 0.229) — Why time works against you, not for you

Support Calls (IV: 0.516) — Your strongest predictor and biggest crisis

Each analysis goes beyond the numbers to reveal root causes, competitive vulnerabilities, and actionable strategies. This is not just data analysis—it is a diagnostic of fundamental business model problems hiding in plain sight.
Takeaways:
The main cause of churn is a complex product that most customers find difficult to use.
Support Calls show frustration is driving churn, not engagement.
Longer tenure increases churn — customers lose patience over time.
High usage doesn't mean satisfaction — people are active but unsuccessful.
Only 23% of customers thrive; 77% struggle and eventually leave.
This is a product-market fit problem, not a customer success issue.
Find the dataset and the four reports: Product Challenges and Market Action Plan, and three intelligent segmentation analysis reports for 'Usage Frequency', 'Tenure', 'Support Calls'.
https://www.capprossbins.cappross.com
Dataset downloaded from Kaggle:
https://www.kaggle.com/code/alihassanshahzad786/customer-churn-prediction/input
Credit Scorecard Model Report
A comprehensive credit scoring model built using Weight of Evidence (WoE) transformation and Information Value (IV) based feature selection. This scorecard segments borrowers into five risk tranches, enabling financial institutions to make data-driven lending decisions.
Key Components:
The model analyzes key credit factors including interest burden, outstanding principal, payment history, and loan concentration to predict default probability. Interactive visualizations allow exploration of individual predictions and risk tranche distributions.
FAQ WOEとIVの分割
CapprossBins、WOE分割、IV計算、信用リスクモデリングについて知っておくべきすべて
まだご不明ですか?
私たちのチームがCapprossBinsを最大限活用できるようサポートします。個別サポート、カスタム実装、エンタープライズ向けソリューションについてお気軽にご連絡ください。